How to cold start fast a java service on k8s (EKS)
In the age of k8s and micro-services its important to start fast, especially if your cluster is running on spot instances, but also if you want a to easily scale-out, restart after a database fail-over or even your own service memory leak.
CPU fractions/millicores/nanocores is something java and its echo-system was not designed and optimized for. For example libraries like Netty that use the number of available processors to decide the size of the multi-event loop, or HikaeriCP a popular jdbc connection pool that uses the number of processors to determine the connection pool size. All those tools and the JVM itself optimize to adjust the best ratio of threads to processors in order to best utilize the CPU and reduce threads context switching. The JVM uses the number of available cores to decide on the amount of GC threads and compiler threads ( jit threads ), and all those threads are competing for the CPU. But what happens when they share 200 k8s millicores? In essence, the mechanism of docker CPU allocation will throttle the container that’s requesting more CPU resources than it was assigned, this will lead to blocked threads and slow execution, pods crashLoopBackOff and can even cause k8s HPA (horizontal pod auto scaler) to wake up and schedule more pods ( since they use so much CPU ) which might cause more CPU throttling…
The problem we had was as follows:
At Bond where I work we write in Kotlin, we had some issues around our deployments of services.
It sometimes took our services almost a minute to start, we didn’t bother at first but then we noticed services had a CPU spike on startup which sometimes caused k8s HPA to spin up extra unnecessary pods, sometimes resulting in launching additional nodes. The CPU spikes also caused significant latency around the deployment time, requests that usually took 100 millis could take seconds.
To be able to better understand and measure what happens to a java service when its bootstrapping in a container in a pod on a k8s node on an EC2 instance that physically located only god and amazon knows where we need to answer the following questions :
- how to measure the time it takes to launch a java* container ? (*openjdk:8-alpine image)
- how to measure the time/resources it takes for the JVM to start ?
- how to measure the time it take to launch a java HTTP server
for this example, I will use a simple vert.x/netty webserver written in kotlin and compiled to java8 bytecode:
Measure the time it takes a pod to become Ready:
averaging this over all the instances of a pod will produce a dashboard of the bootstrap time. ( highly recommended to have one )

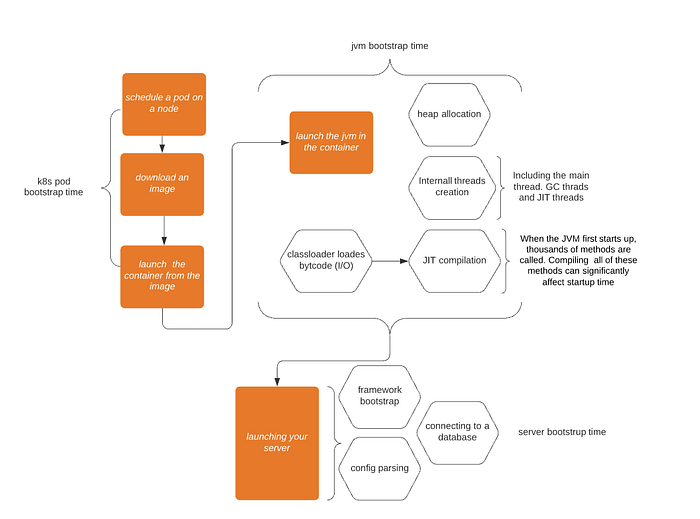
This time is the sum of the following:
- k8s pod bootstrap time
- jvm bootstrap
- server bootstrap

A note about jit, ClassLoader loads byte code that was imported or used in the main method and then its compiled. The more code main method invokes the more class loading and compiling happens. This uses significant CPU during the bootstrap phase since thousands of methods are compiled, so a CPU spike is expected to some extent.
Launch an example service
The example above was given the below resources and deployed.
It took 7 seconds and CPU usage was 100% during the first seconds of the bootstrap.

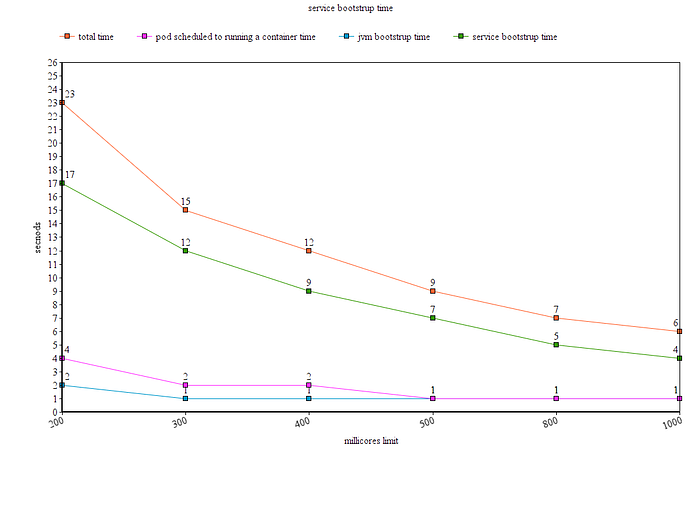
This led me to believe that the JVM needs more CPU and that its being throttled. So I experimented with different CPU limits.
Different CPU limits yielded the following


Since koltin is compiled to java8 byte-code I first suspected that the JVM is not aware it runs in a container.
since vert.x and netty use both the Runtime.getRuntime().availableProcessors() to determine the default event loop size and other resources if the JVM sees the host CPU and thinks its running on a m5.xlarge aws ec2 instance (4 cores) this might explain the CPU spike.
But that was not the reason. I use the following JVM flags - XX:+UnlockExperimentalVMOptions -XX:+UseCGroupMemoryLimitForHeap and when printed the number of available processors and ram, in the cloud, it showed 1 CPU and 0.25G ram as expected.
Collecting pod metrics during its first seconds
If you attempt to run kubectl top pod ${PODID}you will get the following “error: metrics not available yet.”
Another way is to get the metrics directly from k8s metrics service by running:
Or simply by using k8s dashboard, notice it also does not display the CPU usage during these first seconds

This is not perfect but its enough to get the CPU usage estimate of a pod during its bootstrap.
Startup time break down
- pod scheduled to running container
In order to measure this you need to subtract the epoch second of the first line of bash script that launches the JVM from the epoch second of the PodScheduled event.
By adding echo "starting jvm $(date +%s)" to the first line of your dockerfile entry point you will get the first, and the below will provide the last.

- launching jvm
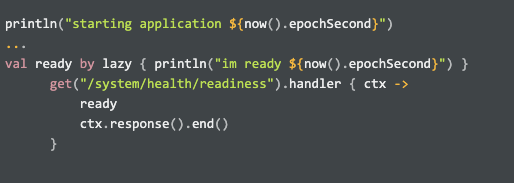
First line of the main method — println("starting application ${now().epochSecond}") minus the time logged by the above echo "starting jvm $(date +%s)" logged by the docker entrypoint
- launching the web server
First line of the main method minus the timestamp of the first readiness+liveness checks.

By running kubectl logs $PODNAME you can get the logs of the launching service and get the needed timestamps for the math.
Production setup
The above example vanilla app is significantly simpler than a production service that has much more dependencies ( more jars to load ), larger image size and more things to do on bootstrap. So container and JVM launch times can be larger in real life.
HPA fine tuning
As I increased the CPU limit the pod startup time improved, but still sometimes HPA created more pods then intended. From k8s documentation
Due to technical constraints, the HorizontalPodAutoscaler controller cannot exactly determine the first time a pod becomes ready when determining whether to set aside certain CPU metrics. Instead, it considers a Pod “not yet ready” if it’s unready and transitioned to unready within a short, configurable window of time since it started. This value is configured with the — horizontal-pod-autoscaler-initial-readiness-delay flag, and its default is 30 seconds
Setting the initial delay to a larger period should give your service more grace time for the initial CPU consuming phase. I would set this value to 1 minute for a JAVA service.
Unfortunately this flag is not supported yet by EKS at the date of this writing.
CPU over commitment
Increasing the CPU limit creates CPU over-commitment that can cause trouble. In order to avoid reaching a point when pods are evicted from the cluster do to high CPU usage, lower your HPA targetAverageUtilization. For example if the expected CPU usage of a service is under 250 millicores and you give it a 1000 millicores CPU limit, its reasonable to set the targetAverageUtilization to 50 or even less.
Summary
Increasing the CPU limit of a java service will cause it to start faster but will create CPU over commitment that needs to be carefully managed.
Other ways to improve the startup time
- using GraalVM, however there are reflection and JNI limitations in conflict with runtime DI tools and netty ( that uses JNI ).
- Vertical pod autoscaler in addition to HPA to avoid increasing the CPU limit. However at the point of this writing this is still experimental and not ready for production.
- upgrade to java 11 and higher, however the improvement should be limited. Since the JVM startup time has the least effect on the bootstrap time of the service .

