Multiline logs in OpenShift EFK stack
Running applications in containers has many advantages, such as horizontal scaling and effective resource management. Developing cloud-native applications needs a different mindset, and getting familiar with new frameworks always has a learning curve. Many features that traditionally were provided by application servers — deployment management, configurations, metrics, security, logging, monitoring, service lookup —now belong to the container runtime environment. This is great as containers are not language specific and applications can focus on the core business logic. On the other hand, cloud-native apps are dynamic and distributed by nature that makes certain task like logging and tracing more complicated.
Kubernetes is probably the most well-known container runtime at the moment. Red Hat OpenShift is an enterprise ready container application platform based on Kubernetes. To resolve the problem of collecting and searching logs from the containers, it’s possible to deploy log aggregation using the EFK (Elasticsearch, Fluentd, Kibana) stack. Understanding and tuning the whole logging solution can be complicated and requires an in-depth look at each component, but the general purpose is to collect and index log lines from the standard output of your containers and label them with Kubernetes metadata. Docker logs are collected by a Fluentd process on each node and are forwarded to Elasticsearch to store, and Kibana provides a UI for lookup.
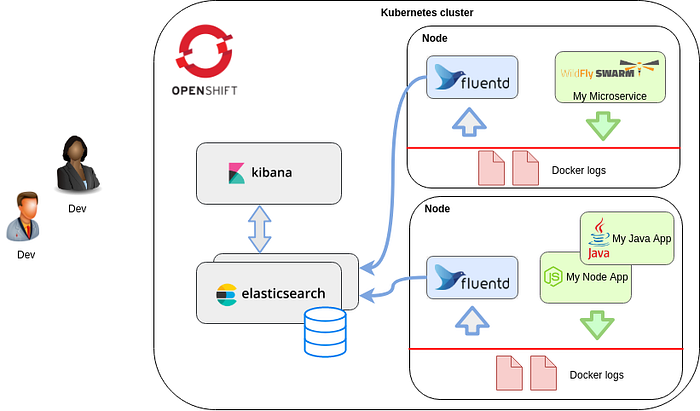
One issue that you may notice once you have managed to boot up your first container on a cluster is that each line on the standard output is handled as a separate log event. It’s fine as long as you build your own log lines, but there are certain scenarios (e.g., request payload, Java stack trace) when you will eventually have multiple lines dropped by your application. Browsing or searching these is tiresome if they are split up line-by-line, so let’s try to find a solution.
The problem starts at the Docker level. Whether standard output from Docker processes ends up in journald or json logs, they are handled line-by-line. The feature request to group multiple lines at this level was a dead-end. It might be possible to collect multiple lines by a regexp in fluentd, but no generic solution seems to exist at this point. Though I hope one day the community will come up with an accepted approach, most discussions around the topic conclude that “you have to handle this in your application”.
Here we try two workarounds that more-or-less handle the problem with minor impact on the application:
- Convert line endings to CR ‘\r’
- Use structured json logs
Software versions used during writing this post:
- OpenShift v3.9
- Kubernetes v1.9
- Fluentd v0.12.42
- Elasticsearch v2.4.4
- Kibana v4.6.4
- Spring Boot v1.5.13
- Logback v1.1.11
- logstash-logback-encoder v5.1
Line Ending Hack
Traditionally, different operational systems use different newline characters. These days the most common is Unix-style LF (\n) and Windows’s CRLF (\r\n), but CR(\r) was also frequently used in the past. Modern software stacks try to ease the pain of handling different line endings by automatically recognizing and converting between the different styles.
Surprisingly with the Openshift EFK logging stack, using CR as a line break for lines belonging to the same log event and having the regular LF between log events works as a simple hack. When we talk about containers we talk about Linux environments with LF (\n) line endings. So somehow we need to modify the log output of the application to convert all the LF characters within one log message to CR, which may or may not be difficult based on the software stack being used.
I mostly build Java microservices, so I tried a Spring Boot app using Logback (the same should work with Log4j as well). This logging framework has a replace feature that can replace a regular expression with a string. Such a log pattern can be defined in application.yml like this:
logging:
  pattern:
    console: %d %5p %logger: %replace(%m%wEx){'\\n','\r'}%nopex%n
It basically replaces LF (\n) with CR (\r), but the expression needs some explanation. The replace conversion is applied on the message %m and the java exception stack trace if there’s one. %wEx is Spring Boot specific, but it’s the exception with some whitespace around like %n%ex. Java string escaping is applied here so the first parameter is a regexp of two characters ‘\’+’n’, while the second is a string with one CR character (see the logback.xml below). The %nopex indicates that we take care of the exception in the pattern, otherwise Logback appends it again by default.
Similar pattern can be set in Logback configuration XML using the unicode value for CR :
Note: because of the special CR character in the pattern layout, it’s not easy to set it via OpenShift ConfigMap or container environment variable (maybe b64 encoded). Typically log patterns are set in the property file packaged with the application, so it’s not really an issue.
This example app logs a message with a line break (line 31) and throws an exception when it starts (line 32). By default all lines were handled as a separate log event. With the log pattern above the log is readable on the pod’s page on OpenShift console (though the log events are broken up to 2K long segments):
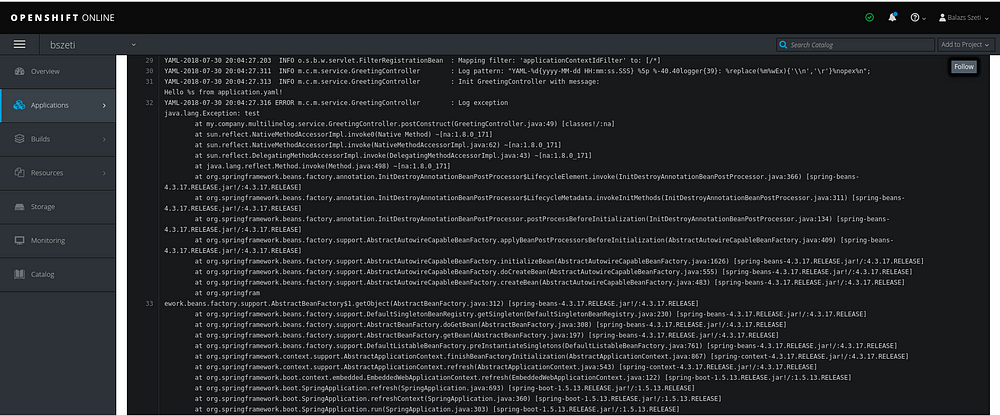
Also in Kibana the log lines belong to one log event as expected:

The json view of the log event shows the linebreaks encoded as ‘\r’, but the line breaks look good in the message field on screen.
The CR characters cause problems if we try to access the pod log with the OpenShift oc client, but a simple script (perl or something else) can be used to convert CR back to LF:
oc logs -f multiline-log-9-sflkm | perl -pe 's/\R/\n/g'Structured json Logs
Though the newline character conversion explained above helps in practice, it definitely feels like something that just accidentally works. As a “proper solution” we should use structured logs. In this case our application needs to wrap each log event in a json message with specific field names where newlines are json encoded as ‘\n’.
For example, our two line init log event looks like this on the standard output:
{"@timestamp":"2018-07-30T17:15:01.127-04:00", "@version":"1", "message":"Init GreetingController with message:\nHello %s from application.yaml!", "logger_name":"my.company.multilinelog.service.GreetingController", "thread_name":"main","level":"INFO","level_value":20000}The OpenShift Fluentd image comes with pre-configured plugins that parse these json logs and merge them into the message forwarded to Elasticsearch. This is beneficial not only for multiline logs, but also guarantees that other fields of the log event (e.g. timestamp, severity) look good in Elasticsearch.
For a Java application with Logback or Log4j, have a look at this detailed post. To enable structured logs we have to add logstash-logback-encoder to the classpath (see pom.xml) and use the LogstashEncoder as in this logback.xml:
The logs look great in Kibana with this configuration, but as a trade-off they are difficult to read on the OpenShift web console or using the oc client as they are json messages.
If you know how to enable structured logs in other development stacks and languages, please add them in the comments or write a post about it…
Summary
Despite the fact that “being able to handle multiline logs” sounds like a simple request, finding a generic solution is complicated with the current toolset available.
Structured logging is probably the right approach, but it’s hard to imagine all the software development stacks agreeing upon a supported structure and moving away from just “dumping text” on standard output. Even if you work with a framework that supports this pattern, it’s only beneficial in production environments.
In development or test environments, the readability of the pod’s standard output is probably more important than search capabilities. The “line ending hack” is a middle-ground solution, and it may also be easier to implement if you don’t have an out-of-the-box solution for structured json logs.


