Observability strategies to not overload engineering teams – eBPF
eBPF is a powerful technology since it allows you to inject custom user-definition programs in the kernel without having to install additional kernel modules or recompile the kernel itself.
One of the strategies I mentioned in my first post, Observability strategies to not overload engineering teams, is leveraging the eBPF approach, to help us achieve observability without requesting engineering efforts.

Today, I’ll show you how to collect telemetry data from a service without code changes, using eBPF and Kubernetes.
What is eBPF
Being very simpler, eBPF provides the ability to execute programs on the Operational System Kernel (it’s like an event handler for sys-calls), so eBPF helps us extend the OS capabilities and leverage the kernel’s privileged ability to oversee and control the entire system.

The Benefits of eBPF
There are a couple of benefits to using eBPF programs to extend the OS capabilities, such as:
- Performance: eBPF can move packet processing from the kernel space and into the user space, so fast.
- Low level of intrusion: eBPF doesn’t require changes to the programs to collect information, such as application traces.
- Security: Programs are effectively sandboxed, meaning kernel source code remains protected and unchanged
- Manutenability: It takes less effort to write code that hooks into kernel functions than it does to build and maintain kernel modules.
eBPF projects
There’re a couple of nice projects built on top of eBPF in different areas such as Traffic Management, Security, and Observability as you can see on the list down below.
You can see the entire eBPF application landscape in eBPF.io, there’s a massive list of different projects, but today I’m going to show you how we can leverage Pixie to achieve out-of-box observability and don’t overload the engineering teams.
What is Pixie
Pixie is an open-source observability solution for Kubernetes applications, which uses eBPF to automatically collect telemetry data without the need to overload the engineering teams by adding manual instrumentation.
Pixie joined the CNCF as a SandBox project in 2021 and has a lot of cool features such as Scriptability, which allows you to extend the Pixie platform by using flexible Pythonic query language.
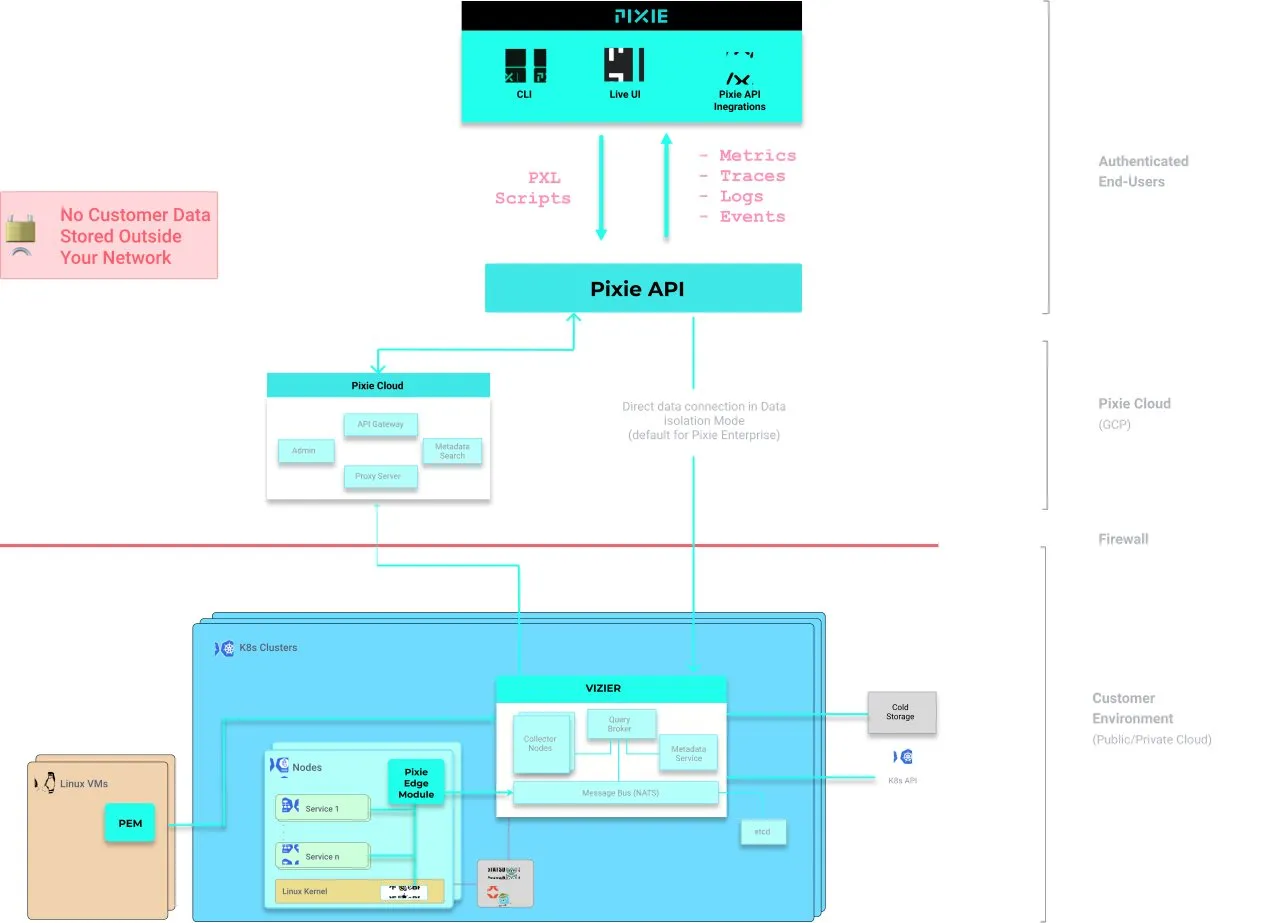
Pixie’s Architecture
The Pixie platform consists of multiple components for specific use cases such as:
- Data Collection
- Data Store
- Platform Extensibility
- Visualization
Platform hosting infrastructure
As I mentioned at the beginning of the article, most of the eBPF applications are being built with Kubernetes in mind, and because of this first, we need first start a local Kubernetes cluster to implement Pixie.
I’m gonna use Rancher Desktop to spin up a local cluster, be aware that you need to use Containerd since Pixie doesn’t support Docker, for more information about Pixie system requirements please check this document.
Setup Pixie
Before installing Pixie on our local Kubernetes cluster, you can create an account on the Pixie Cloud that is free forever to make things a little bit easier.
Install Pixie CLI
It’s not required, but this blog post will be useful to install a pixie demo application, you just need to follow the steps described on this page.
Create a deployment key
The deployment key is required to allow the instance running on Kubernetes to push data to Pixie Cloud, you can create this, through the Pixie UI by clicking here.
Adding Helm repository
You can install Pixie using different strategies, such as Pixie CLI or plan YAML files, but I’m will use Helm charts, just because it’s easier and GitOps friendly.
# Add the Pixie operator chart.

helm repo add pixie-operator https://pixie-operator-charts.storage.googleapis.com

# Get the latest information about the Pixie chart.
helm repo update
Right after running the commands above, you’ll be ready to install Pixie onto your cluster.
Install Pixie with Helm
Now you just need to run the following command to install pixie using the Deployment key you’ve created.
helm install pixie pixie-operator/pixie-operator-chart --set deployKey=<deploy-key-goes-here> --set clusterName=o11y --namespace pixie --create-namespaceIt will take a few minutes to have all the components up, running, and healthy, you can use the following commands to check if everything is prepared.
# Check pods are up
kubectl get pods -n pl

# Check Pixie Platform status
px get viziers

# Check PEM stats
px get pems
After you’ve all the services healthy, you can access the Pixie UI, by clicking here.
Setup Pixie Demo App
Now you have all the Pixie components up and running, and also have access to the UI. It’s time to install a demo application that will produce fake traffic to help us explore the UI.
There are four different demo applications, and you can see all those available by using this command.
px demo list
---
Pixie CLI
Table ID: demo_list
  NAME                DESCRIPTION
  px-sock-shop        Weaveworks' Sock Shop microservices demo.
  px-online-boutique  GCP's Online Boutique microservice demo.
  px-kafka            Microservice demo that uses Kafka to communicate between 3 services.
  px-finagle          Microservice demo that generates thriftmux traffic with finagle.
We’re going to use the px-sock-shop, you just need to use the command below.
px demo deploy px-sock-shopThis command will install a set of applications under the px-sock-shop namespace, and after all the pods are healthy, we can see the HTTP Metrics such as Throughput and Latency, as you can see in the image below.

Pixie Features
Pixie is an observability tool that requires zero configuration to start collecting a bunch of telemetry data from your application and infrastructure, below we can see what kind of cool feature Pixie offers by default.
For more details and demos about the features, please check the official documentation.
Pixie Drawbacks
Pixie is an awesome tool and provides engineers with great features as I've described above, but not everything is flowers, below I'll describe two main Pixie drawbacks.
Long-term data retention
Pixie doesn't offer long-term data retention and if you need to achieve this capability, you need to leverage a plugin that sends data to an OpenTelemetry collector or send your data to a New Relic Account.
There's a default data export in OpenTelemetry format, but if you have any custom data inside your Pixie instance, you need to write your Pixie script to send that data to the Otel collector.
Even if you send that data to an OpenTelemetry collector, you will not be able to query that data through Pixie UI.
ARM supporting
Each day this is a very usual use case, companies are leveraging ARM/Graviton machines to reduce their costs, as well as energy consumption.
Unfortunately, Pixie still doesn't provides support for ARM architectures, as you can see on this GitHub issue, since 2020.
Conclusion
This is a very simple example, and the main idea is to provide insights into what type of telemetry data could be collected using an eBPF-based solution such as Pixie.
If for some reason Pixie doesn't fit your use case requirements, don't worry, there are other tools such as Cilium Hubble that offer good and similar features, or if you're a rooter you can write your own eBPF program to collect whatever data you want.
Let me know if you’re leveraging this on your company to collect telemetry data or aim to use it.
Thanks 😃