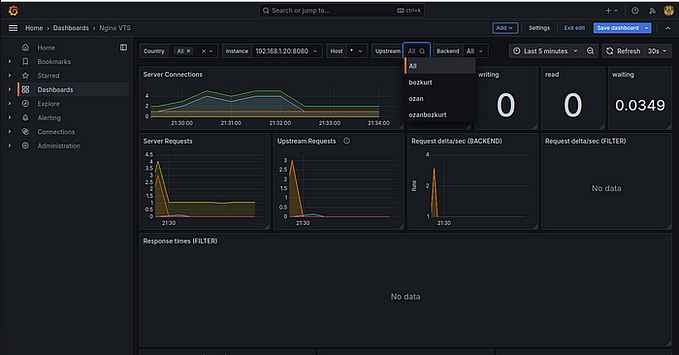
When a powerful metrics collection tool meets an awesome visualization tool, that unleashes the real power of an effective monitoring system. Prometheus is a powerful metrics collection and alerting system. Grafana is one of the best visualization tools which can be used with Prometheus. We can create a dashboard with multiple charts together in Grafana. Grafana has out-of-the-box integration with Prometheus. We just need to setup Prometheus as the data source and we are good to go.
In this article, we are going to set up the Grafana dashboard which fetches data from the Prometheus server. We have already seen how to setup Prometheus and AlertManager which can be referenced for given links. We are going to see Grafana setup with Ansible and data source setup so Grafana can easily access data from Prometheus which we can use in dashboards.
Grafana setup steps are mentioned below:
- Install and configure Grafana
- Add Prometheus data source to Grafana
- Creating dashboards from Prometheus metrics.
Let’s setup Grafana using Ansible. We are going to use the yum module of ansible to install Grafana using the link found on the Grafana website.
- name: Install grafana
  yum:
    name: https://s3-us-west-2.amazonaws.com/grafana-releases/release/grafana-{{ version }}-1.x86_64.rpm
    state: latest
Once Grafana is installed, we are going to copy Grafana config file to its required destination and restart Grafana server.
- name: "Grafana configuration file copy"
  template:
    src: "grafana.conf.j2"
    dest: /etc/grafana/grafana.ini
  notify: event_restart_grafana- name: "Grafana server started"
  service:
    name: grafana-server
    enabled: true
    state: started
When everything is ready, we verify that Grafana is accessible on port 3000 which is the default port of Grafana.
- name: "Check if Grafana is accessible."
  uri:
    url: http://127.0.0.1:3000
    method: GET
    status_code: 200
As of now, we have Grafana installed and running on our instance as we can see by accessing on required IP with port 3000 (default port).
Setup data source to Prometheus on Grafana using the below steps:
- Go to http://grafanaIp:3000

2. Enter the username “admin” and password “admin”. Click Log In. Then provide a new password which will be used in future login attempts.

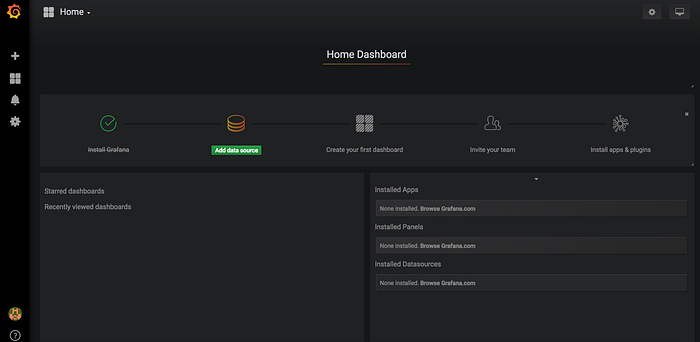
3. Click “Data Sources” on the screen.
4. Look for Prometheus data source for our configuration.
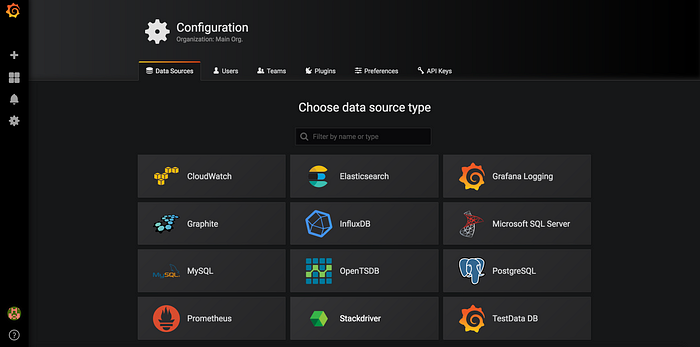
5. Click Prometheus data source and provide below details:
Name: Prometheus
URL: http://prometheusIp:9090
Basic Auth: Disabled as currently disabled on Prometheus server
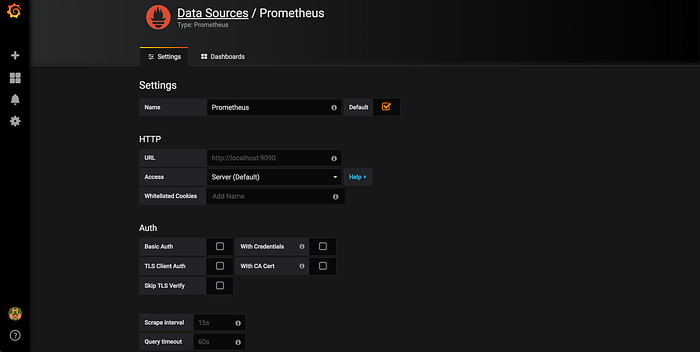
6. Click Add and Test Connection to verify everything is working properly. Once done, we have a Prometheus data source ready to use.
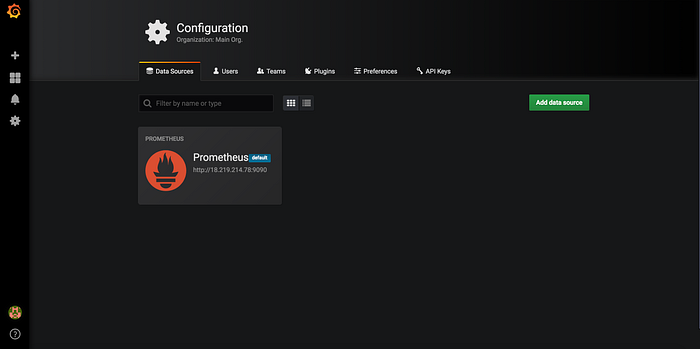
Once we have a data source set up completed. Next, we need to set up our dashboard using Prometheus data source which can be done using the below steps:
- Go to the dashboard option using “+” on the top left
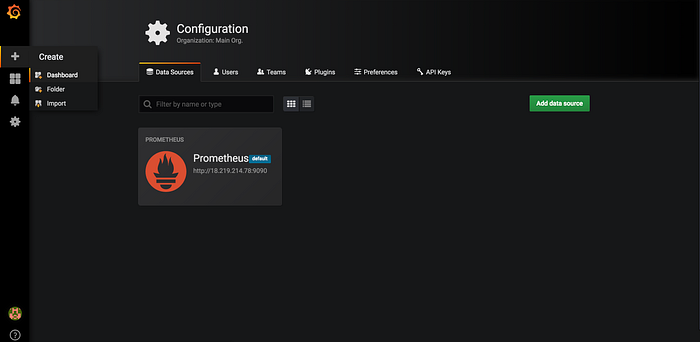
2. Add a graph in this new dashboard by clicking the “Graph” option
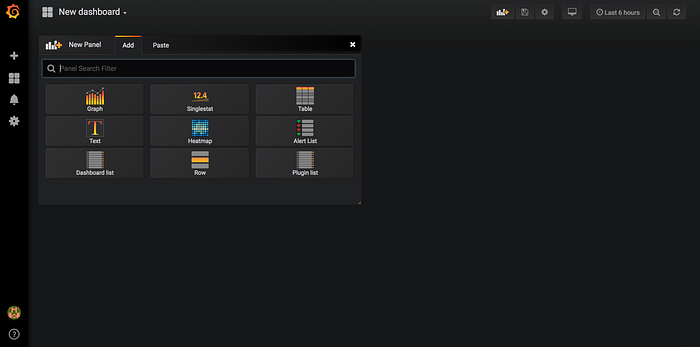
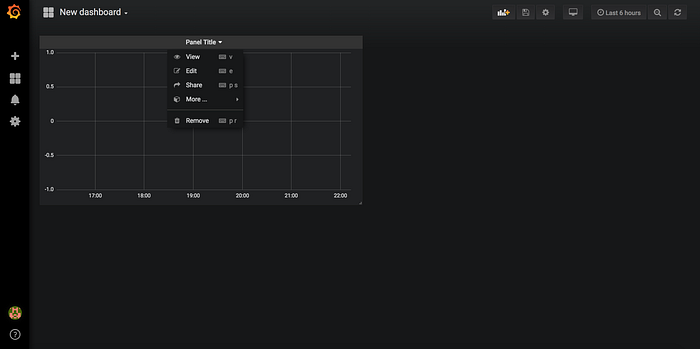
3. We have an empty graph created in our dashboard which needs query and data source. This can be done by clicking on “Panel Title” and select Edit option
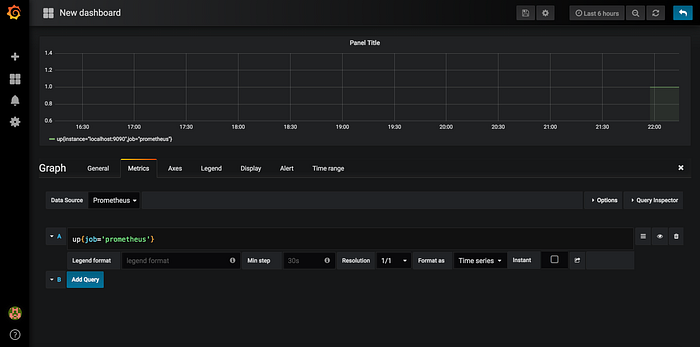
4. Select “Prometheus” as a data source. Go to query option and add Enter PromQL query “up{job=’prometheus’}” in the “Query” field which will draw a graph which shows “up” state of Prometheus server. We can add any query here based on our requirement. PromQL is a query language used with Prometheus.
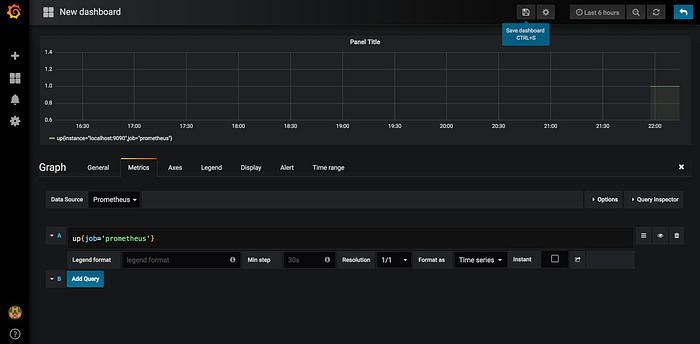
5. Once everything is done, we need to save our dashboard for future usage. This can be done by clicking the save button on top right and give our dashboard a name.
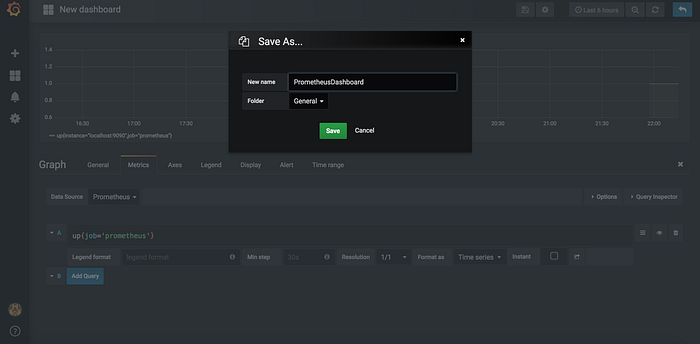
With this, we achieved setup of Grafana with dashboard fetching data from Prometheus.
The complete code can be found in this git repository: https://github.com/MiteshSharma/PrometheusWithGrafana
PS: If you liked the article, please support it with claps 👏. Cheers


